Feature deep dive
Geographic Traffic Distribution by country
See where clients hit your edge — Top Countries ranked by request volume and a live world map — without leaving the WSL Proxy admin dashboard.
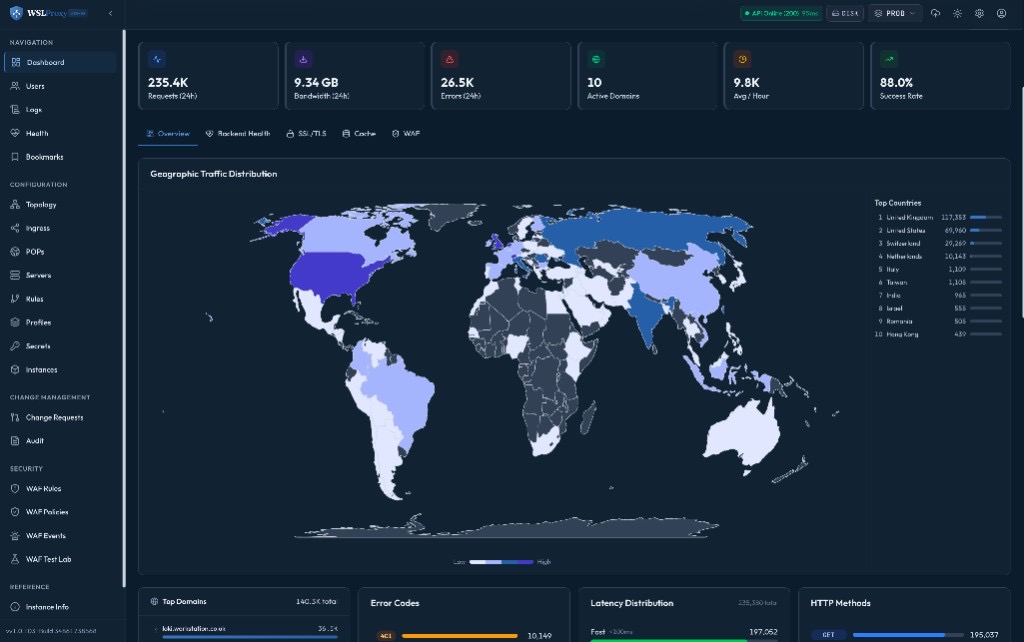
Watch on YouTube · Full product intro (20 min)
Why geo traffic belongs in the control plane
Edge operators already know how much traffic they serve. The harder question is from where. Country-level demand drives WAF geo rules, capacity planning, CDN POP placement, and abuse response. Shipping that view into a third-party analytics product means another hop, another identity, and another delay.
WSLProxy records country on the request path and surfaces it next to the same Overview KPIs you already use — requests, bandwidth, errors, success rate — so geo context stays inside the gateway control plane.
What the dashboard shows
How it works on the hot path
- Client IP — typically
ngx.var.remote_addr(respect real-IP / trusted proxy config when behind Cloudflare or another edge). - IP2Location —
geo_lookup/log_handleropen the binary DB fromsettings.ip2location_path(with on-disk fallbacks to the ansible install path under OpenResty). - Normalize — IP2Location’s
UKis mapped to ISOGBso world-atlas polygons light correctly. - Aggregate — counts land in the
traffic_statsshared dict for hourly / rolling windows. - API → UI — authenticated
/api/traffic/statsfeedsGeoTrafficMapin React Admin and the Next.js dashboard.
$geo_country. If you ever see INVALIDDATABASEFILE, the configured DB path is missing —
point ip2location_path at the real BIN (or keep the /tmp symlink ansible now maintains).
Platform features this sits beside
Geographic Traffic Distribution is one slice of the same live-config edge platform:
- Dynamic routing — path / IP / country / JWT / S3 / cookie match without nginx reloads for rules
- Traffic engineering — weighted, canary, sticky, least-conn backends
- WAF — policy packs, monitor or block, including geo deny lists
- SSL & cache — auto-ssl, edge static cache, optional Varnish
- Observability —
/metricsfor Prometheus/Grafana plus in-product traffic stats - Control plane — Admin UI, Swagger REST, MCP,
wslproxy-cli
Operate it in production
- Keep the IP2Location BIN installed (ansible
cdn-dependencies→/usr/local/openresty/nginx/…). - Ensure Vault/SOPS
settings.jsondoes not point at a deleted/tmppath after install. - Reload OpenResty after fixing the path so workers re-init
IP2LocationPath. - For fleet charts, scrape
job=wslproxy-edgesinto the obs Prometheus that powers Grafana.
Try it
https://wslproxy.org
https://youtu.be/4G_YPYj3J3k
https://github.com/bwalia/wslproxy
Open the admin Overview tab on your POP (for example lon1.pop0.uk), confirm Top Countries fills after traffic, and share the map with whoever owns abuse and capacity.